The Institutions Are Here!
Market Update: Capital Flow

This week, the Securities and Exchange Commission (SEC)’s 13F filings disclosed record-breaking institutional adoption for Bitcoin, including many financial advisory firms, hedge funds, and even a US state pension fund. With over 500 holders, about 200 times the average for new ETFs, these regulatory filings provided remarkable data from just the first quarter since the ETFs went live. These filings and recent macro developments likely drove the positive price action for Bitcoin. On the macro front, the Bureau of Labor Statistics (BLS) revealed that inflation is slightly cooling. While inflation remains well above 3% and is likely to stay sticky, the S&P 500 and Nasdaq responded positively to the news, reaching ATHs. Also, Bitcoin surged back to levels above $67k. What to expect next? I have a comprehensive market update for you, featuring a key chart!
Market Surge or Intermission?
A few weeks ago, I discussed with paid subscribers whether we would see an immediate continuation or an intermission. Many signs pointed towards an intermission, suggesting the ATH was slightly premature. However, comparing this cycle to the 2nd and 3rd Halvings, we concluded that, despite the likelihood of an intermission, there is a high chance of staying above Key Levels like the STH cost basis.
According to our cycle comparison of bull markets, we are 66 days into this drawdown, which is longer than nearly all pullbacks during a bull market. Besides the duration of this consolidation, capital flows observed in this week’s chart reveal significant insights!
Giveaway Announcement
The winner of the “Hard Cap“ for block 844,000 is subscriber with hash: cd0e55bda219a22f81f8cde9d69435d5d286c96d841205e1bbd88b56fa9ff219
Congratulations, you will be emailed shortly!

Don’t trust, verify! Click here to watch the 👉 VIDEO of how Bitcoin and Merkle Trees are used to provide proof for an honest giveaway. Next week’s giveaway is at block 845,000!
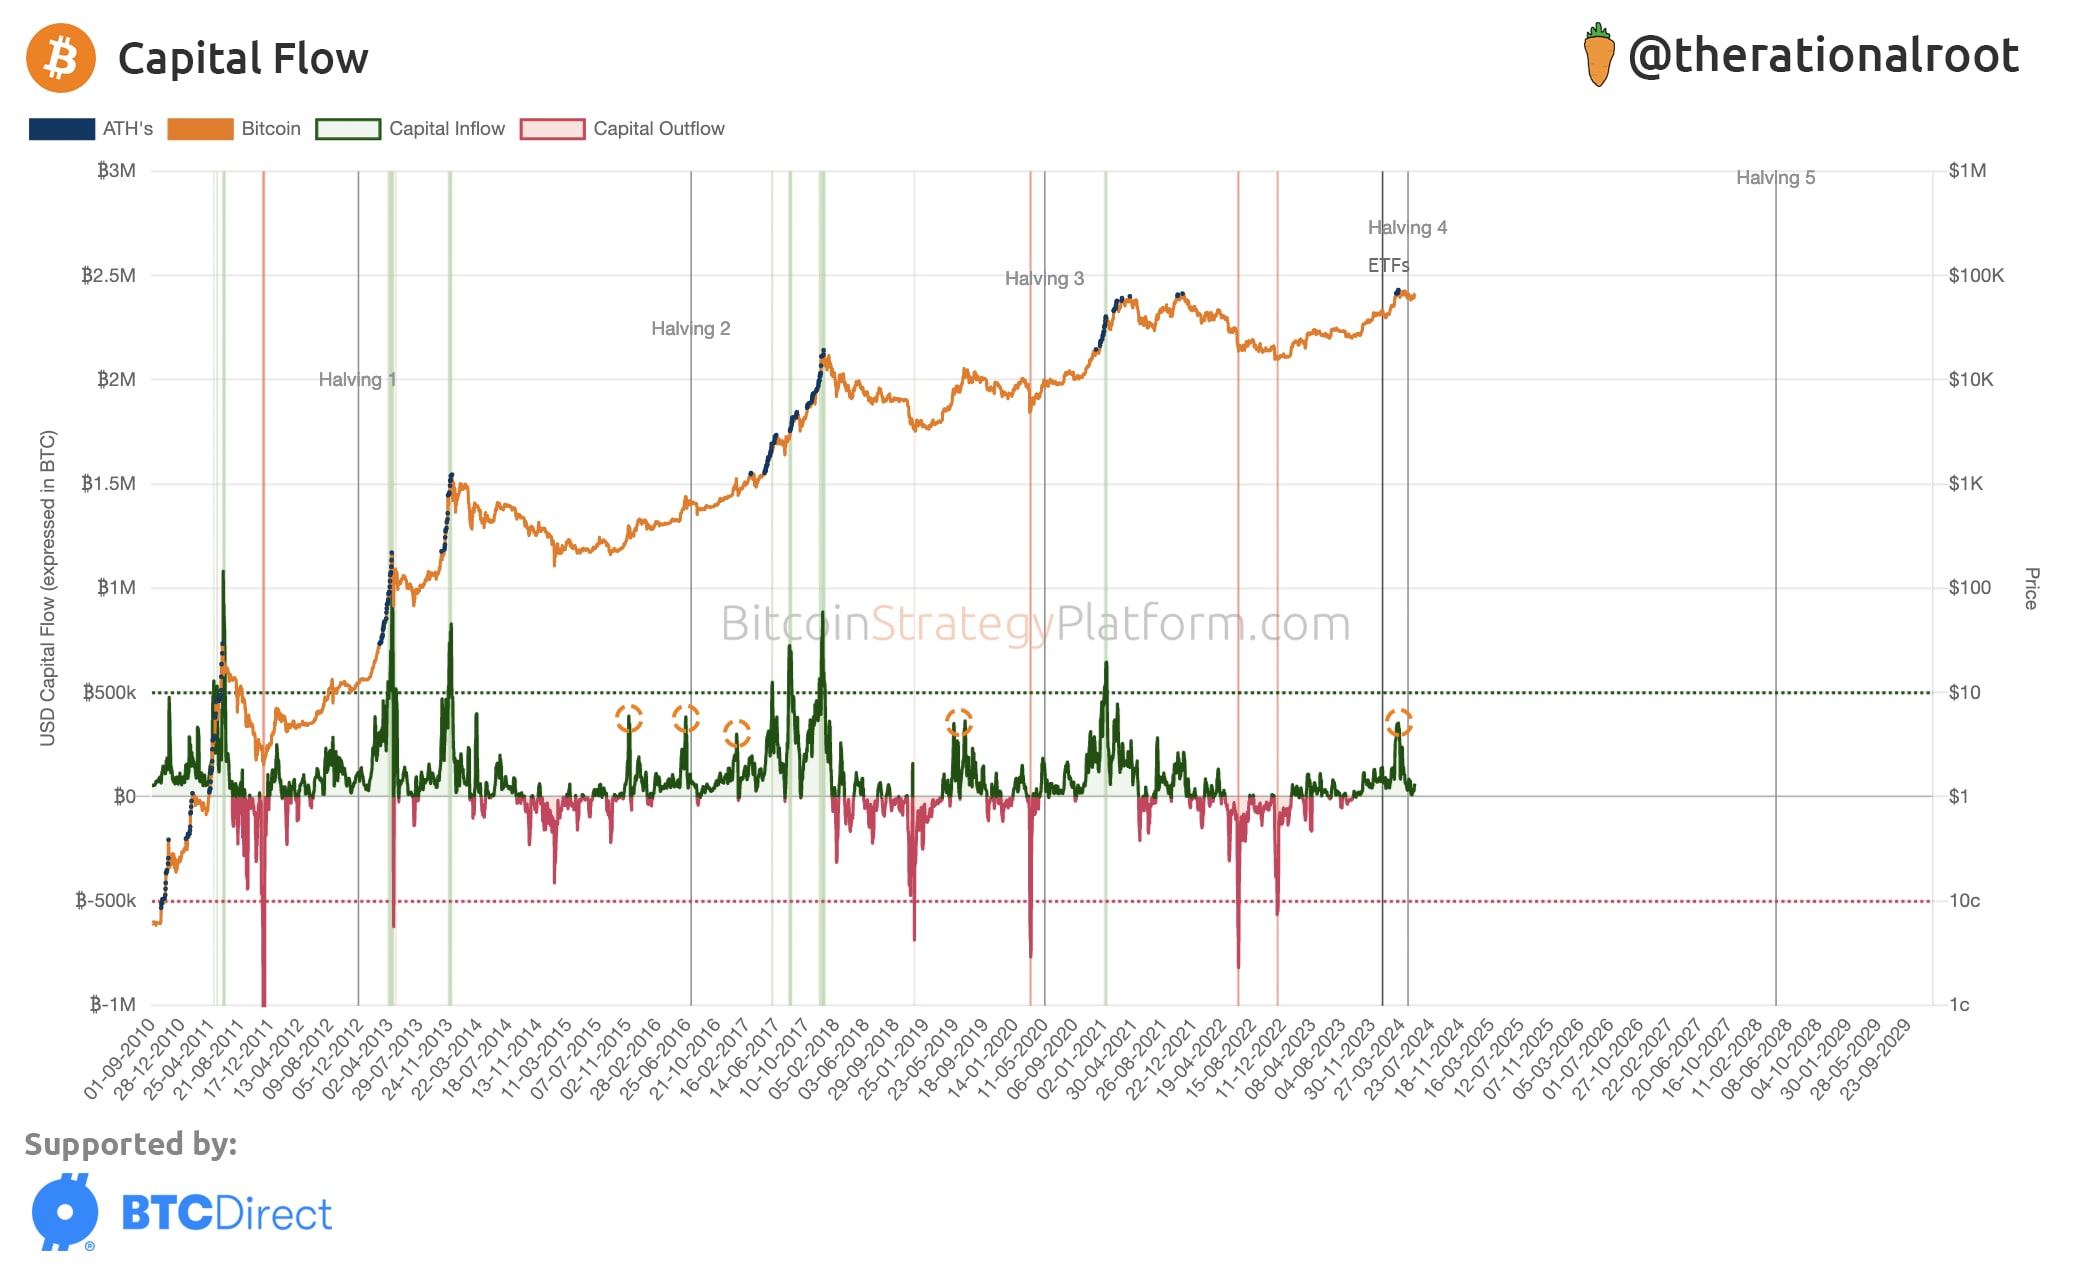
Capital Flow
The following chart shows the real capital flowing in and out of Bitcoin. On a given day many coins change hands, some at a profit, some at a loss. The capital flow is the delta between the price purchased and the price sold, tracking real capital flowing in or out of the space. For example, if I bought a coin at $40k and sell it today at $60k, only $20k of real capital is entering the space. Capital Flow is the aggregate of these deltas.
Get access to premium live indicators, charts, and full newsletter content, alongside a lifetime 25% discount.