

Make or Break: Retest of Key Resistance Levels
NEW CHART: On-Chain STH & LTH Ratio

Dear Bitcoiners,
As discussed last week, momentum has been picking up, and with it, bullish sentiment. Bitcoin is now moving through the supply distribution gap, on its way to retest the STH cost basis.
This week we’ll look at the key resistance levels, compare current price action to historic bear market behavior, and introduce a new on-chain chart tracking the ratio between the STH and LTH cost basis!
With global conflict de-escalating, demand for risk assets has returned. The S&P 500 and Nasdaq have made new all-time highs. Bitcoin has rallied as well, but remains below key resistance levels.
Key Resistance Levels (live chart freely available)
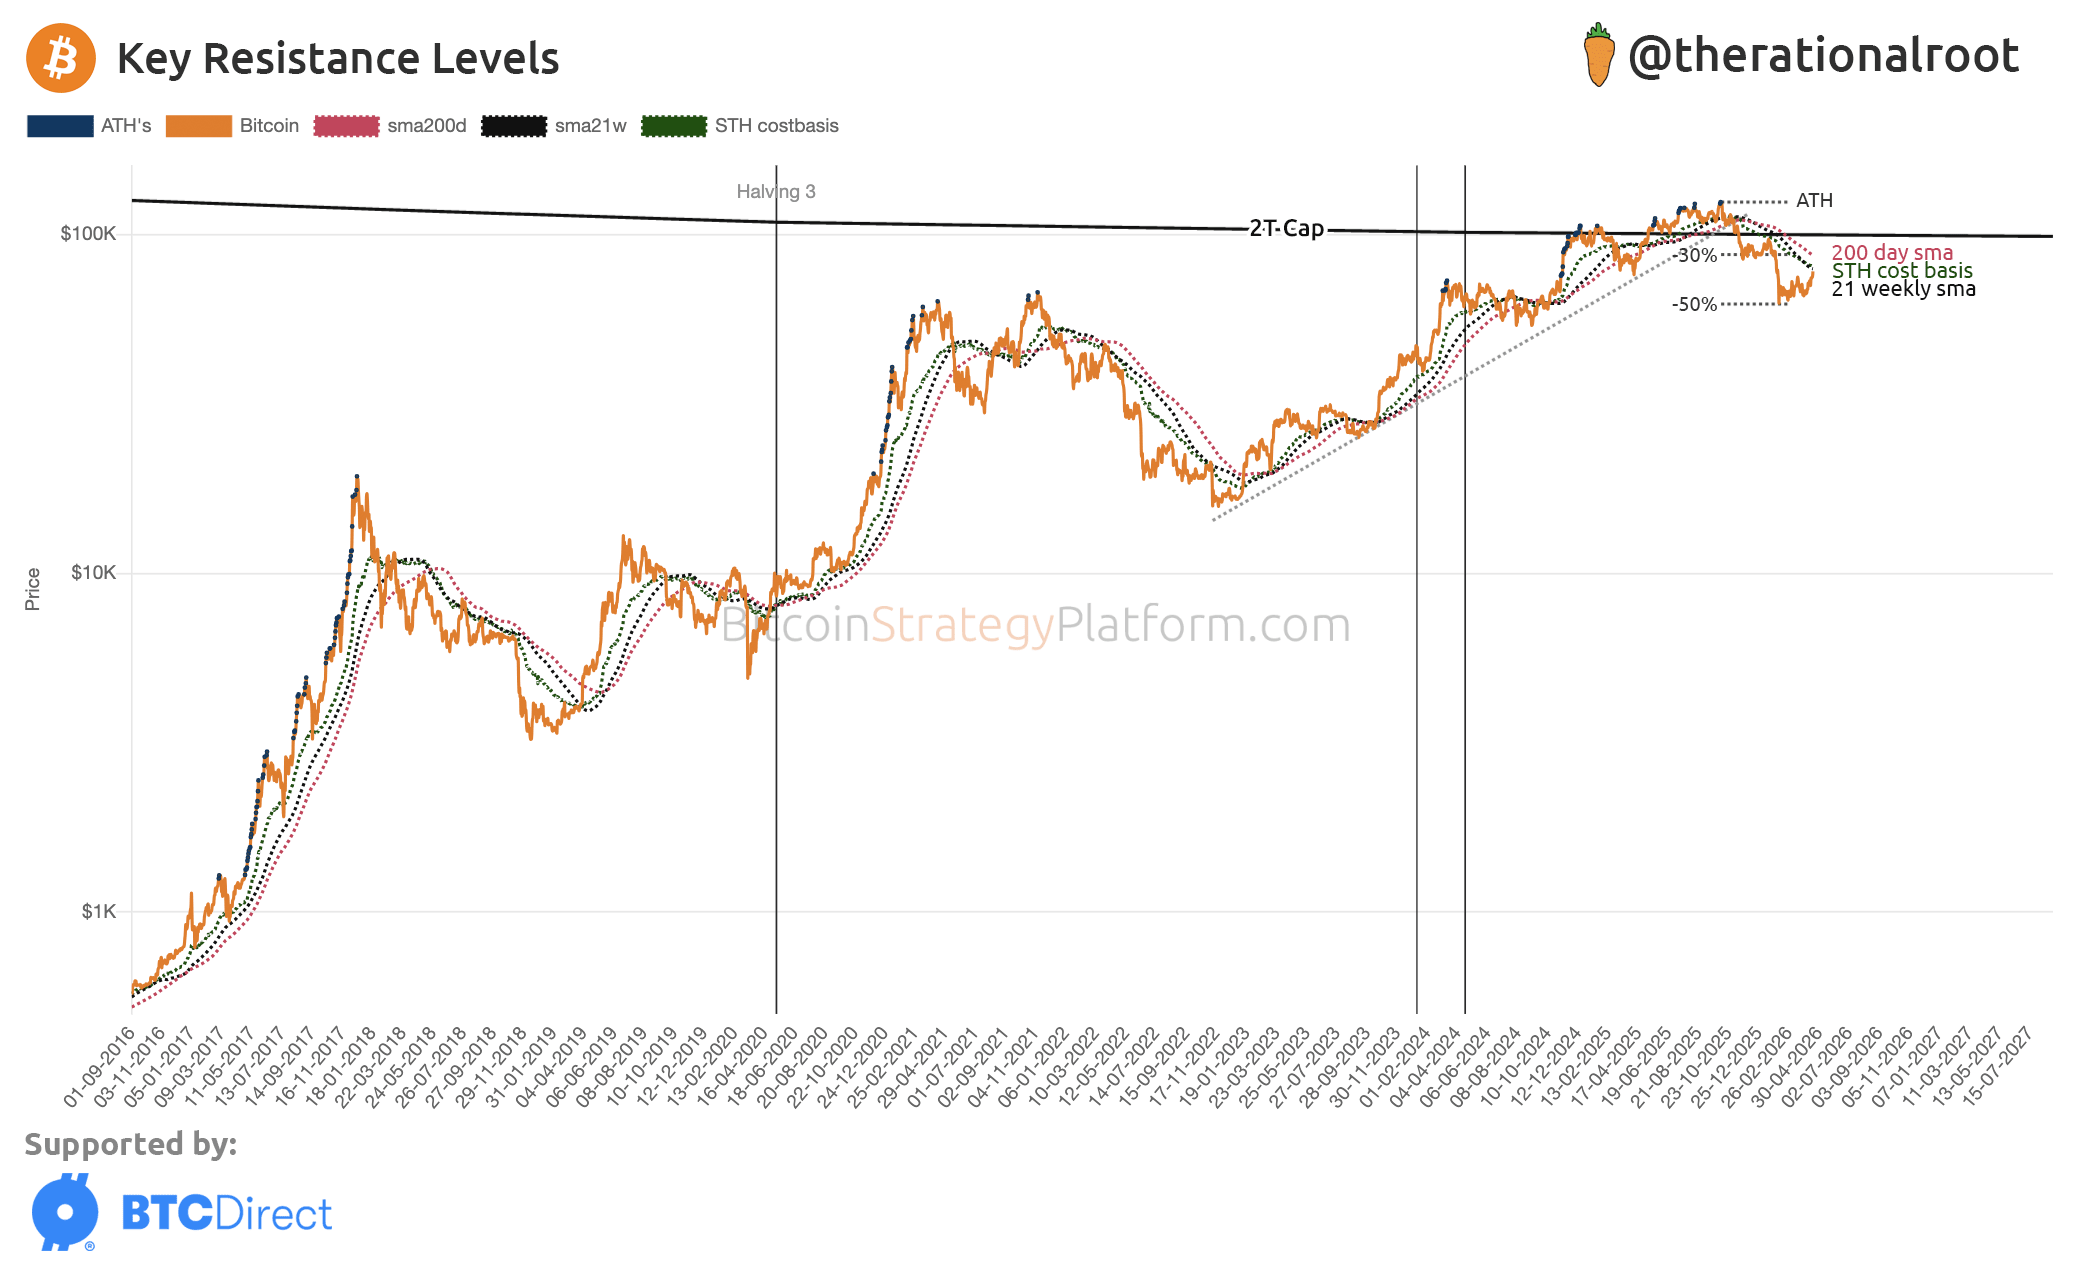
👉 Key insight: A retest of the key resistance levels is a make or break moment.
The key resistance levels:
21-week moving average: $79.3k
STH cost basis: $81k
200-day moving average: $87k
Is momentum strong enough to push Bitcoin back into a bull market? As mentioned last week, current sentiment may suggest so. But when compared to historic bear market behavior, the odds are against it.
The prudent approach is to turn bullish once Bitcoin breaks above, retests, and holds the STH cost basis as support. If we do break above, this could resemble a 2019 scenario. With indicators like the ISM PMI moving above 50, that scenario is not impossible. However, based on current price structure and on-chain signals, the behavior still closely resembles previous bear markets. Historically, this phase is followed by rejection at resistance and a final move into low consolidation.
As mentioned before, there is a key difference this cycle. We continue to see strong institutional demand. Treasury companies and products like Strategy’s STRC are seeing record inflows. These passive flows could dampen downside and prevent Bitcoin from reaching the deep undervaluation levels seen in previous cycles.
