


Dear Bitcoiners,
This week I’ve got some great insights to share, as usual with the charts for you to track everything yourself! We’ll look at Bitcoin’s trajectory by comparing the current recovery to previous cycle bottoms. We’ll also look into the macro developments that are highly relevant for Bitcoin, including rising rates, what they mean for the business cycle, and how this could affect Bitcoin. And perhaps most useful to track, we’ll look at Bitcoin’s recovery progress step by step, highlighting the important support and resistance levels, including the ETF Cost Basis and much more. I hope you enjoy this one!
Cycle Comparison: Recovery Progress Since the Bottom
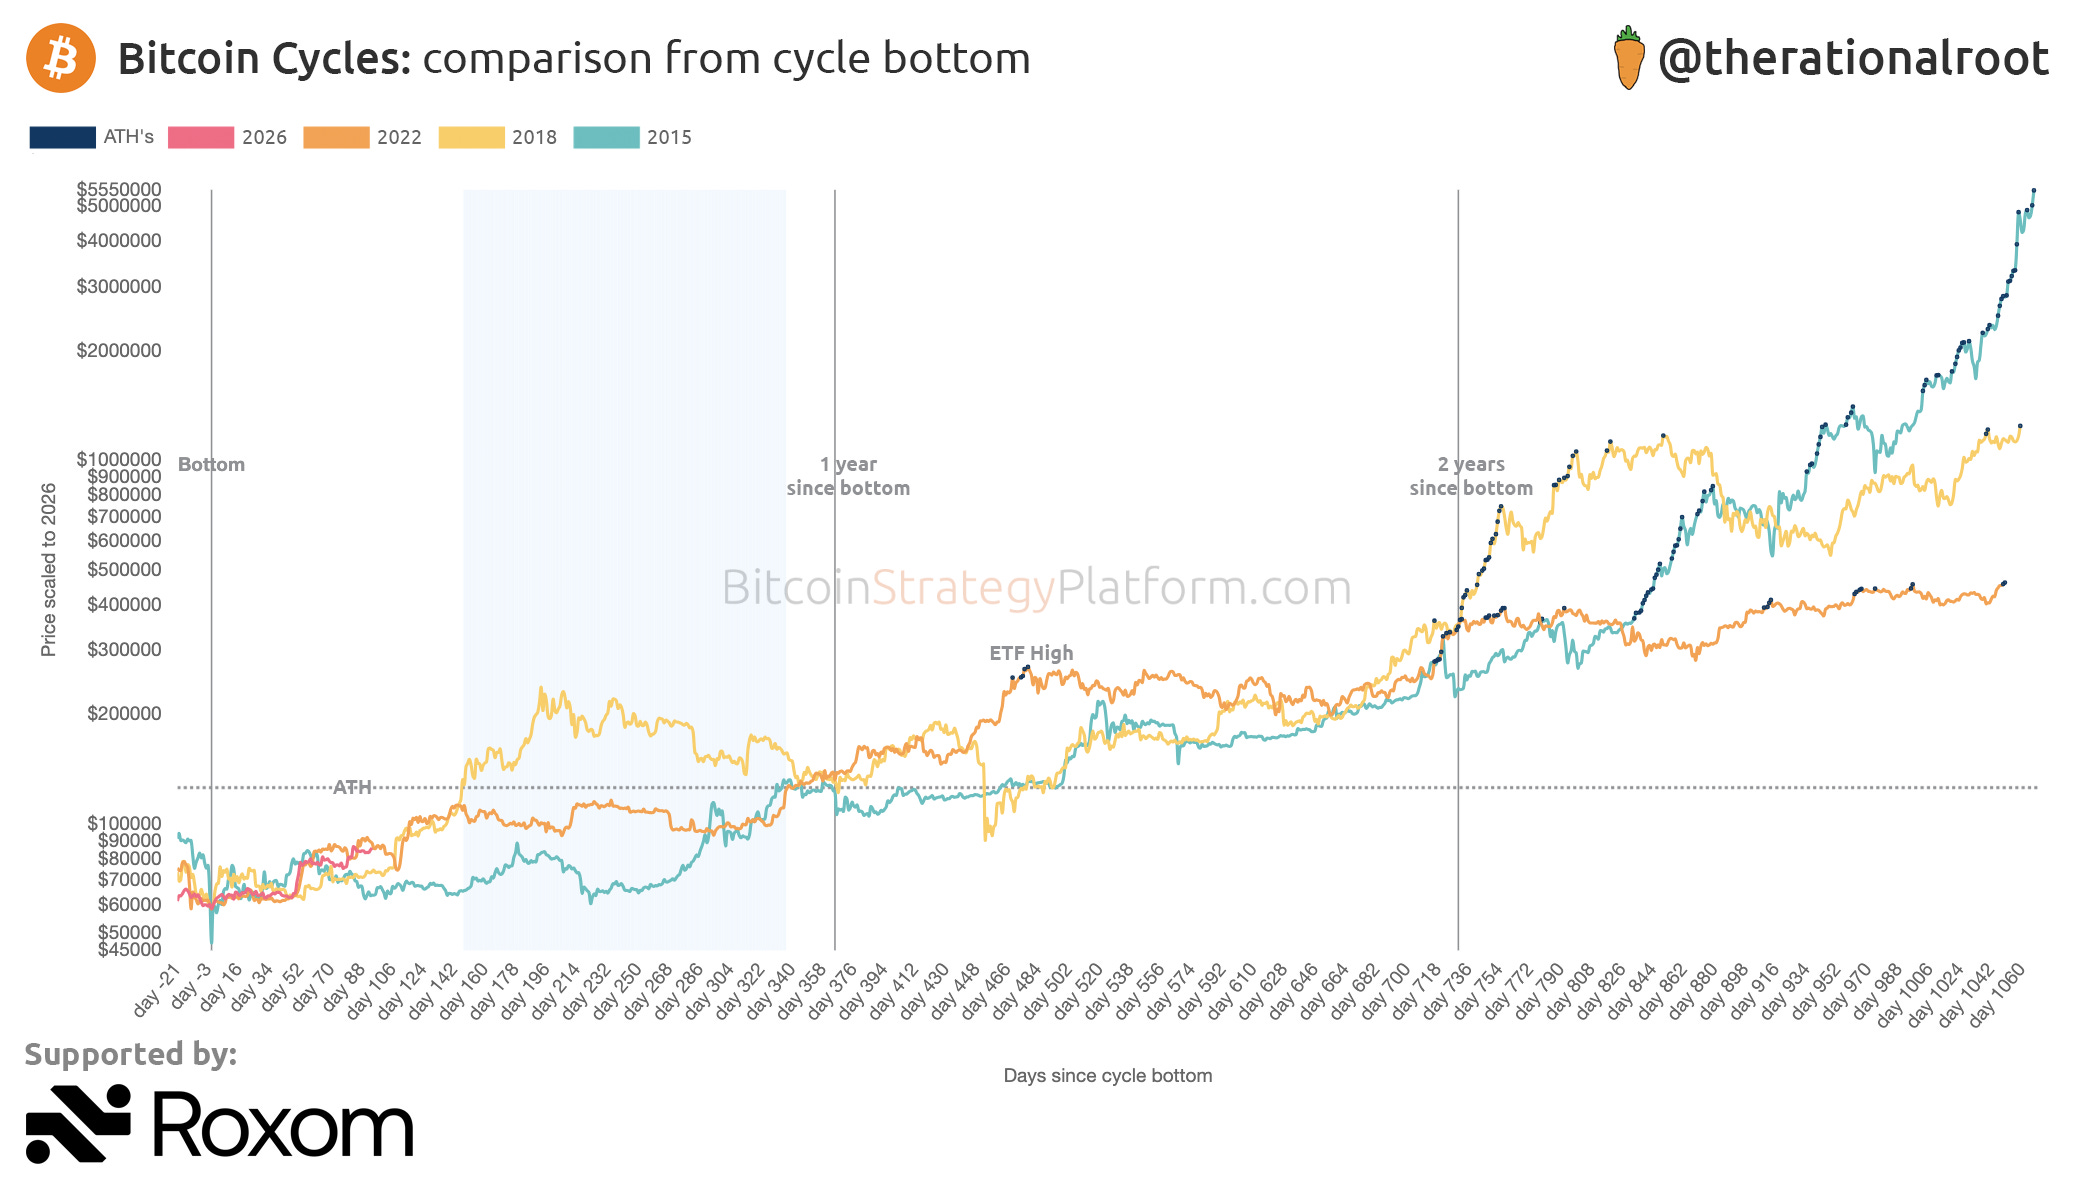
Last week, we discussed how Bitcoin broke through the ETF Cost Basis and is now battling with the On-Chain Value Map’s Fair Value. We also discussed what it would mean if Bitcoin manages to push above Fair Value. Today, we’ll compare current price action with previous cycles and try to determine what the recovery trajectory toward new ATHs can look like. We measure each cycle from its cycle bottom, assuming the current cycle bottom is in.
Unlock access to the Bitcoin Strategy Platform with all premium curated live charts and indicators. Claim your 25% lifetime discount today!
Historically, the recovery process took around two years before reaching the ‘exponential phase’ of the bull market, visible in the chart by the dark blue ATH dots. During the past cycle, for the first time in Bitcoin history, we saw new ATHs significantly earlier, largely as a consequence of the ETF approval, marked as ‘ETF High’ in the chart. Another important difference is that we’ve increasingly been dealing with distributed tops instead of the historical blow-off tops. The previous cycle top of $126k is displayed by the horizontal dotted gray line. Once the current cycle’s red/pink line pushes through that ATH, new blue dots will appear.
👉 Key insight: If Bitcoin follows a similar recovery trajectory as previous cycles, instead of the historical two years, we should reach new ATHs by around the one-year mark at the latest, around June 2027. Possibly already sooner, highlighted by the blue zone, roughly within 2 to 6 months.

My sponsor Roxom just launched Bitcoin Line of Credit refinancing, BLOC ReFi, allowing existing bitcoin-backed borrowers to refinance at 7.25% APR. You can reach them directly on WhatsApp.
To get a more complete overview, however, we also need to consider the macro environment, higher interest rates, and the important resistance levels still ahead.
Before we jump into the step-by-step progress chart with the key resistance levels, let’s first look at the macro picture and the latest business-cycle data that just came in.
