

Global Liquidity UP ⬆️
Bitcoin Year-To-Date High

TLDR; It isn’t strange that Bitcoin has held up well, considering the latest data on global liquidity levels, the performance of correlated risk assets, and the overall sentiment in the space.
After a pause in rate hikes last month by the Federal Reserve, the US money supply M2 ceased its 15-month decline. With the M2 of the US, Europe, and the UK remaining relatively flat and China and Japan increasing their money supply, we saw a decent move up in Global Liquidity.
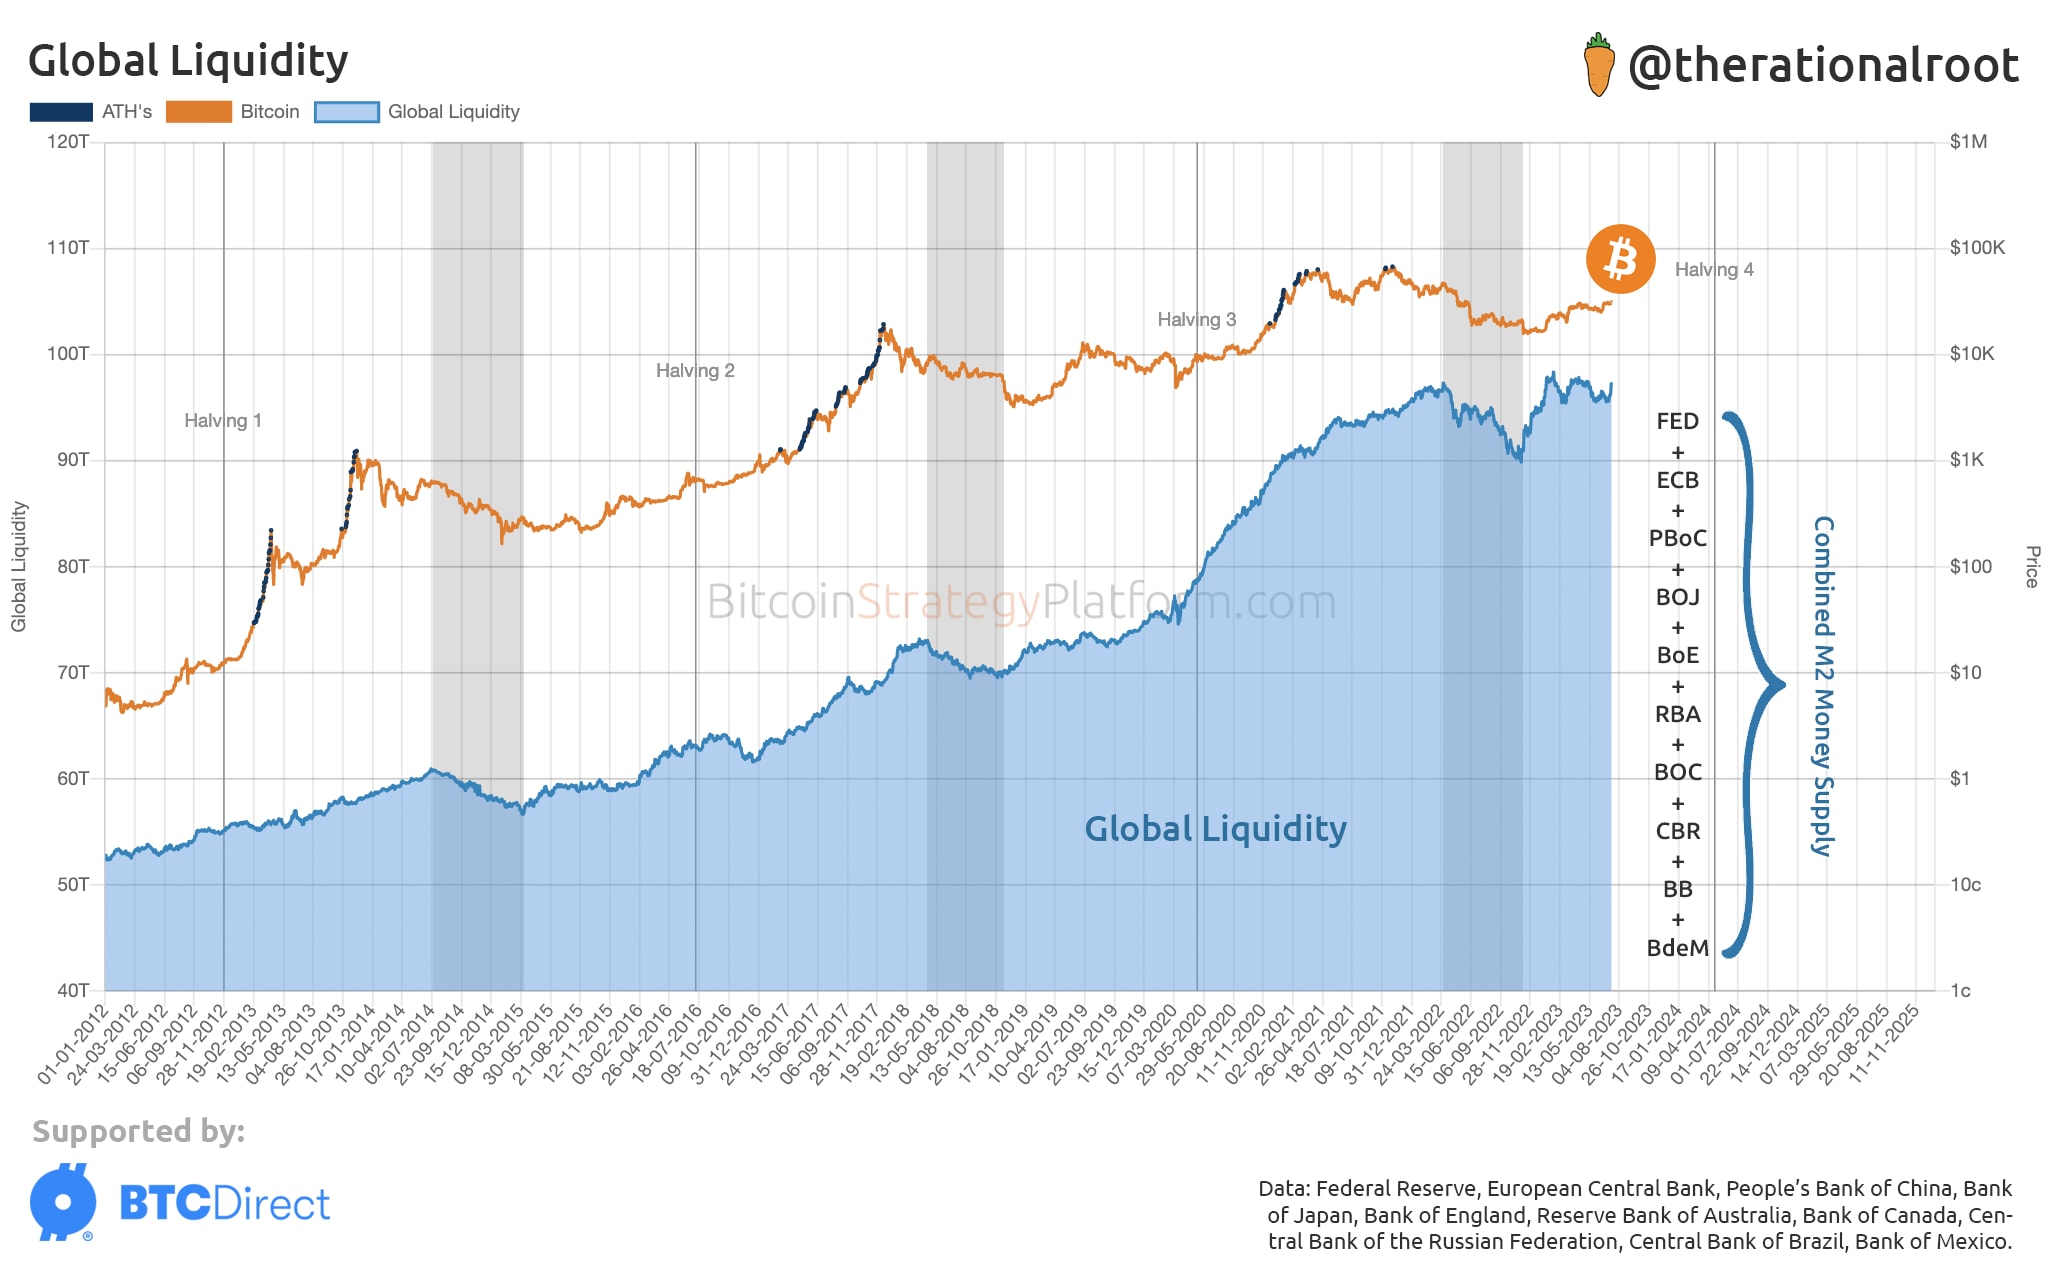
👆 View live chart at the Bitcoin Strategy Platform.
Concurrently, risk assets like the S&P 500, and Bitcoin, have not disappointed.
Despite various indicators hinting that a possible economic downturn may still be on the horizon, current sentiment towards "risk assets" remains elevated. The below chart shows how the S&P 500 is on a roll.
Note that Bitcoin is on a log scale and the S&P 500 is on a linear scale.
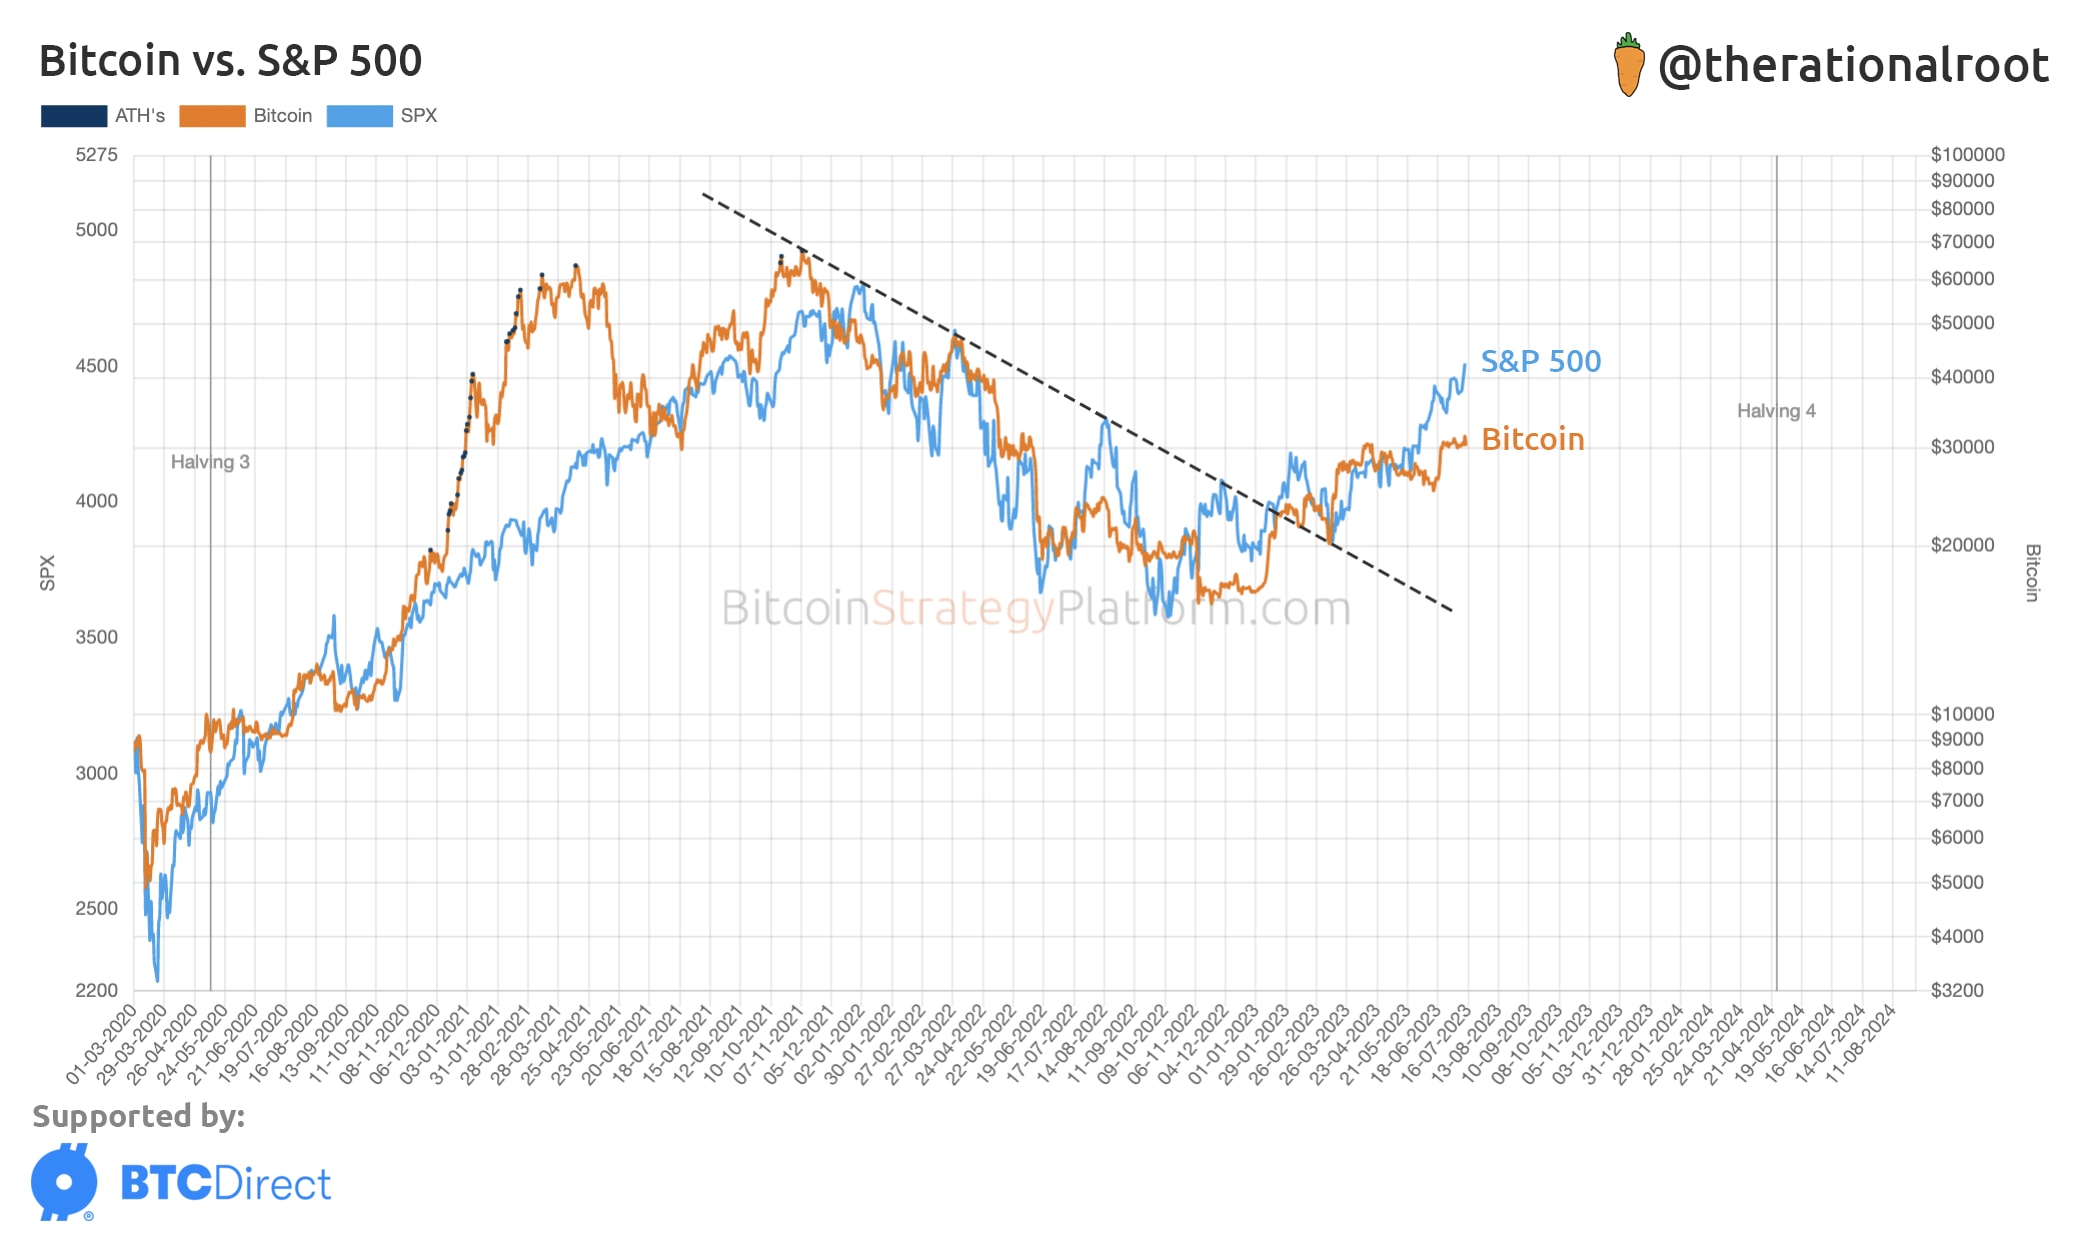
👆 View live chart at the Bitcoin Strategy Platform.
Following a brief period of decorrelation brought about by the SEC's scrutiny of major exchanges like Binance and Coinbase, Bitcoin and the S&P 500 have now resumed their positive correlation.
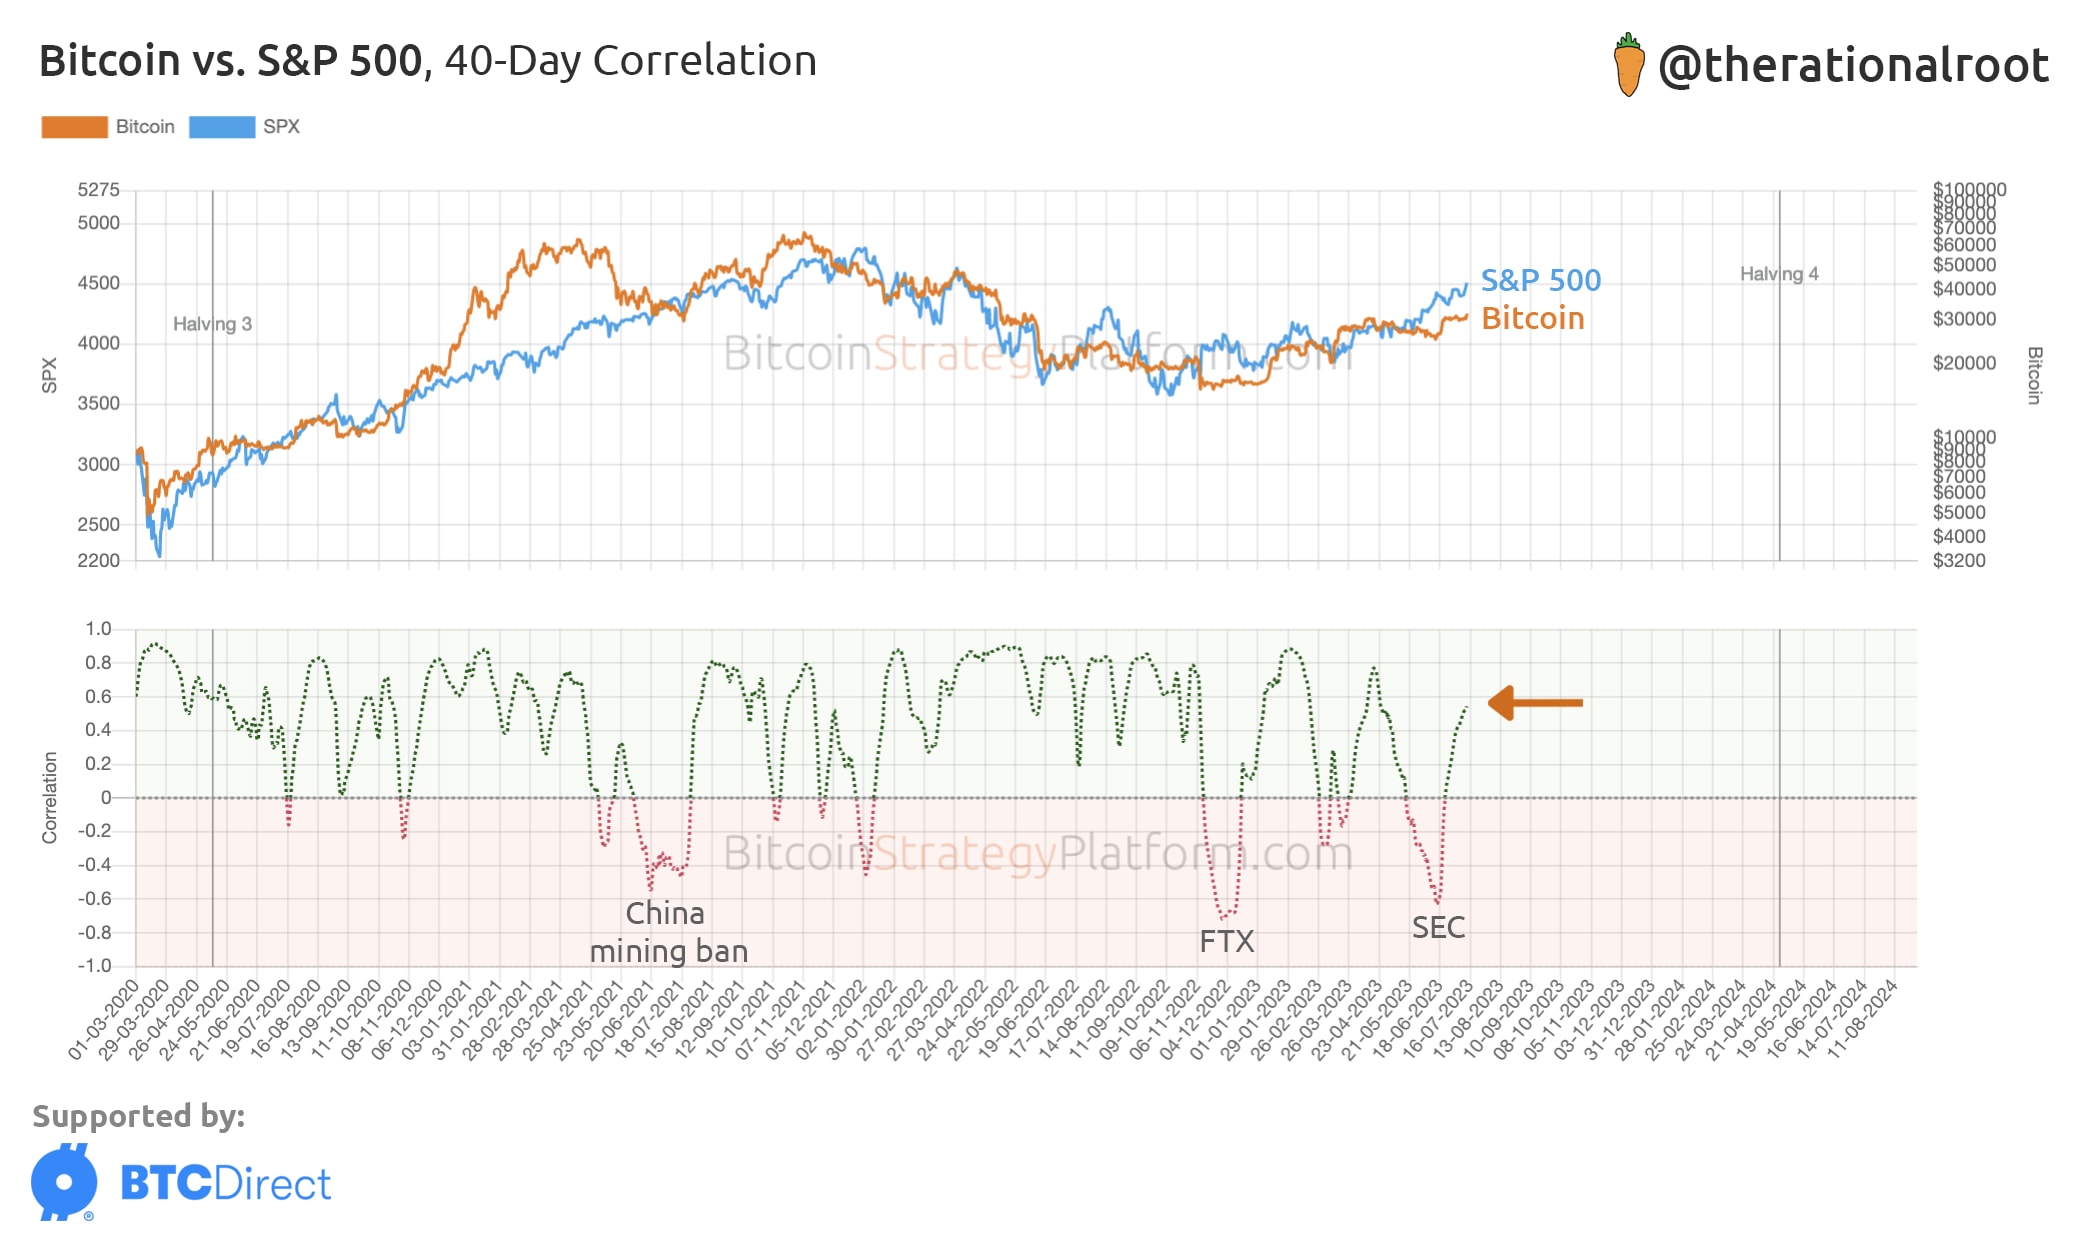
👆 View live chart at the Bitcoin Strategy Platform.
In addition to the above, recent positive sentiment within the crypto industry has contributed to the latest rally of Bitcoin hitting nearly 32k and making a Year-To-Date high. As a judge ruled that XRP is not a security when sold to retail, many altcoins rallied and also caused Bitcoin’s price to spike.
But Root, aren’t we in a stagnation phase? How come these rallies occur?
