

Early Bull Market
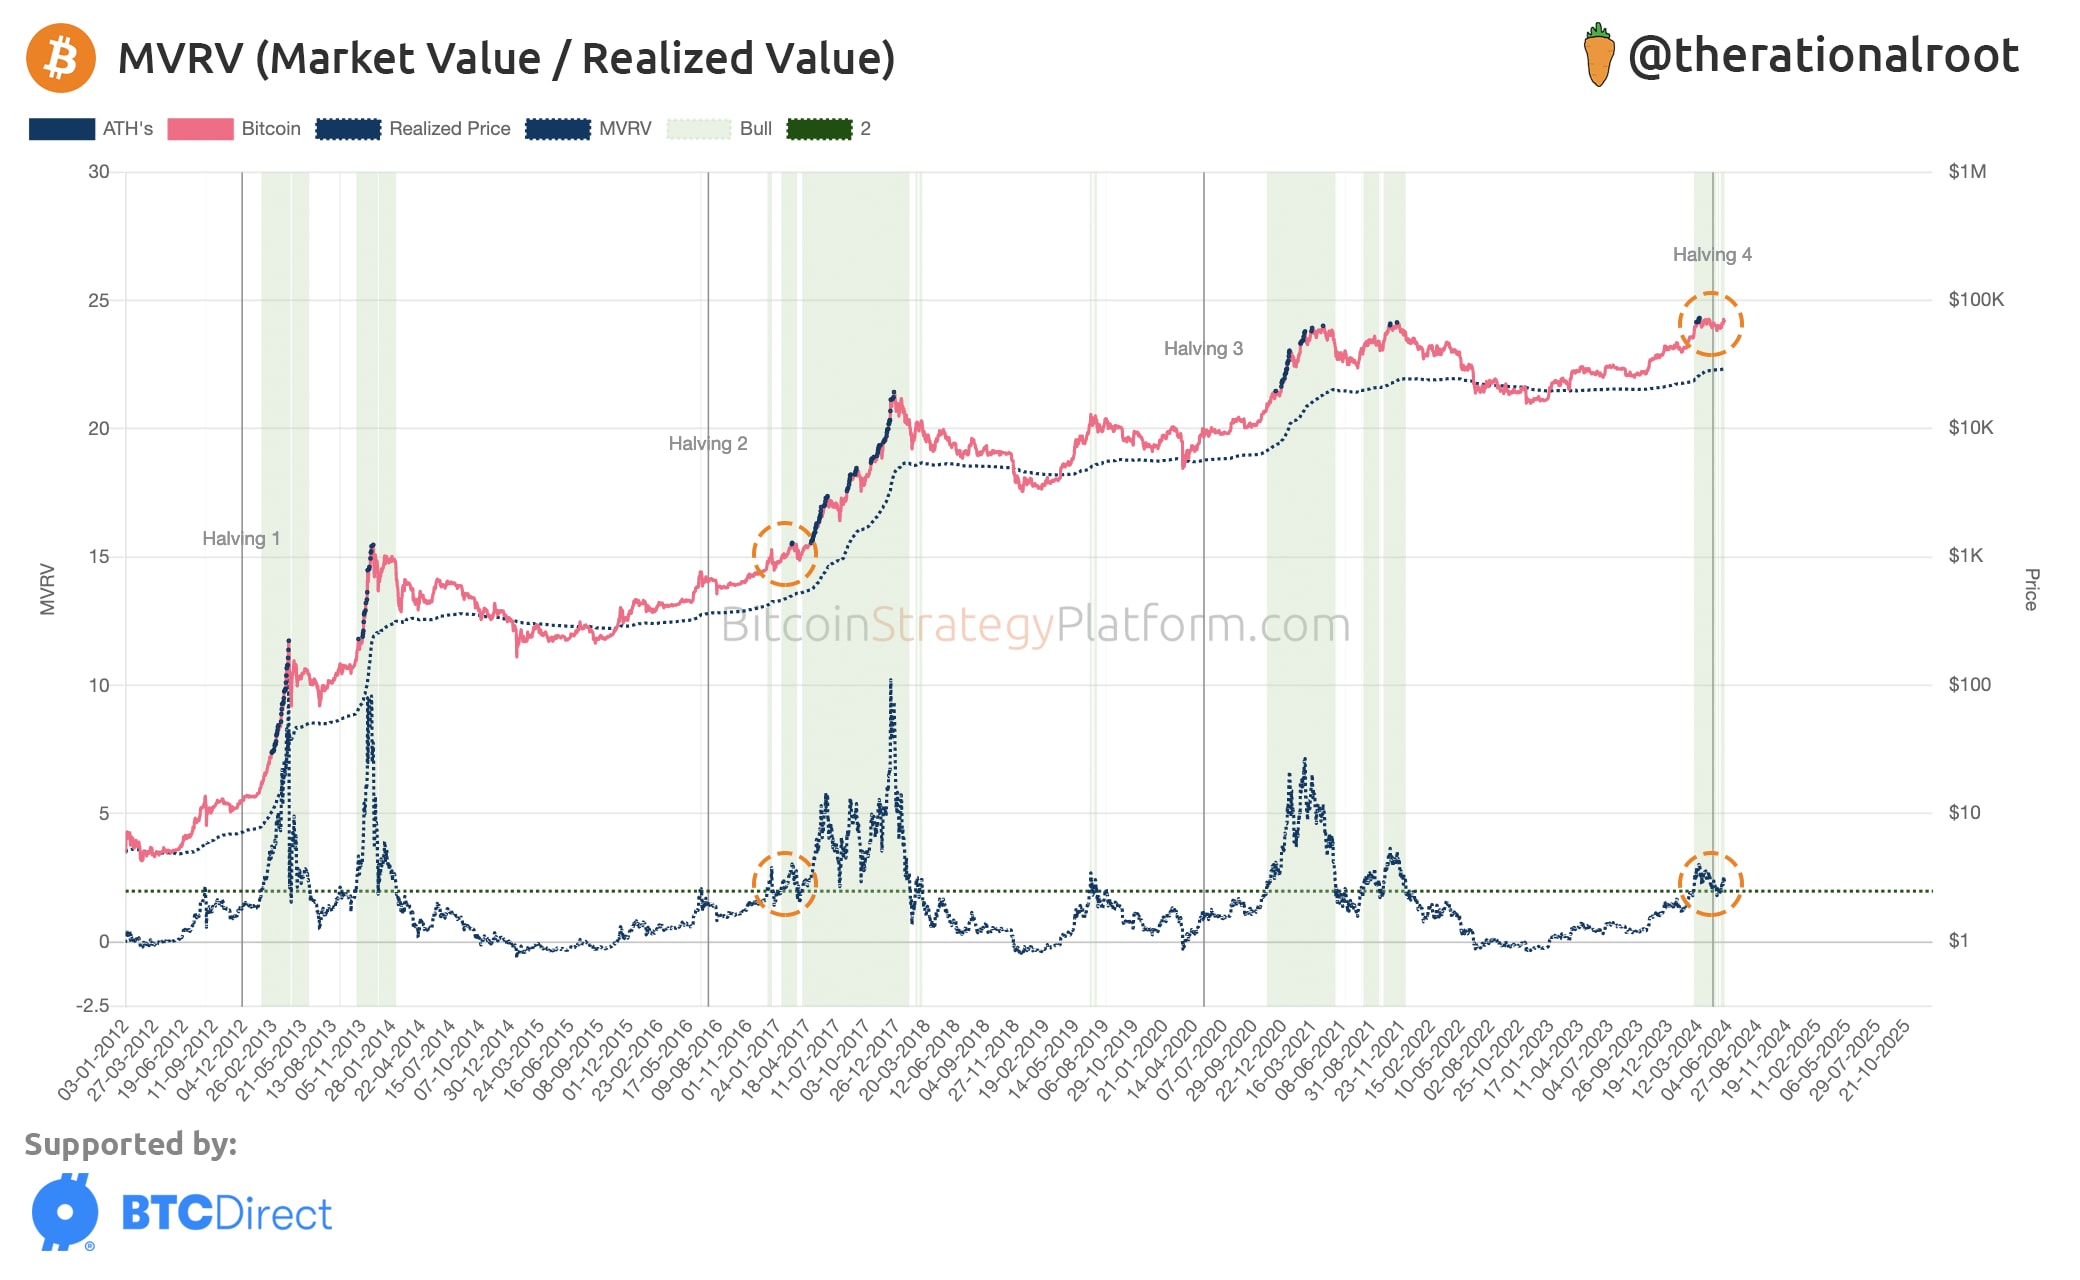
New Chart: MVRV

Dear Bitcoiners,
What a week, with ETH ETFs getting approval. The SEC surprisingly approved multiple Ethereum ETFs, a move that no one was expecting. This approval seems to be less about fundamental value and more about political strategy, with the US election around the corner. Many young people are into crypto, and this decision appears to be targeting that key demographic. The fact that crypto has become a sufficiently important topic for campaigns highlights the size and influence this space has gained. Another factor is that ETF issuers have made substantial profits with Bitcoin’s extremely successful launch. The fundamental difference between Bitcoin and altcoins is that Bitcoin is considered a commodity, while altcoins are generally viewed as securities (according to the Howey Test). If there can be an ETH ETF, there is no reason many other altcoins won’t follow. The ETFs are likely to start trading within the next few months, and similar to Bitcoin, there is the Grayscale ETH Trust, which already holds 3 million ETH and charges a 2.5% management fee. Bitcoin experienced heavy outflows from Grayscale; what happens to Ethereum remains to be seen.
In our previous newsletter, we analyzed capital flow and drew similarities with previous cycles, namely 2016/2017 and 2019. If you missed it, you can find it here:

Today, we continue our analysis with a long-overdue chart: MVRV. MVRV stands for Market Value to Realized Value. It’s the market value (market cap) divided by the realized value (realized cap). The Realized Cap is the sum of the value of all coins at the price they last moved. This means each coin is valued at the price it was last transacted, not the current market price, giving a more accurate reflection of the actual capital inflow into Bitcoin. Unlike last week’s chart, where we looked at the change of this capital flow, with MVRV, we compare it to the market cap, which values each coin at the current price.

Each Week a Giveaway
The draw for the giveaway of Block 845,000 has been closed. The winner of this week's cap will be selected based on the hash of block 845,000. More information is available on our giveaway page.
MVRV
This chart is now live and available to paid subscribers.
As highlighted in the chart, when the price extends two standard deviations above the actual money invested, we enter bull market territory (green areas). Conversely, an MVRV value below 0, meaning the market cap is lower than the money invested, represents the bottom formation of a cycle.
Key Insights
We are only three months into the bull market (as defined by MVRV > 2).
A bull market typically lasts longer, except in 2019 for reasons we have previously discussed.
A bull market typically extends to an MVRV of at least 5.
We’ve currently only seen two ATH dots.
The current situation closely mimics two rallies of 2017, both in price and MVRV score. Interestingly, these points align with the point marked on our capital flow chart from last week.
We still find ourselves in the early stages of the bull market (MVRV below 3).
Breaking above an MVRV of 3 would send us into parabolic territory.
Gain immediate access to MVRV and other premium indicators and charts, alongside a LIFETIME 25% discount.
If history is any indicator, an MVRV of > 3 seems likely. Disclaimer: I cannot predict future values, this is not financial advice.
Having this chart in your arsenal is powerful. I truly hope you found this analysis useful. As always, let me know what you think in the comments below. 👊
Until next week, 🧡
-Root
Indeed very useful indicator, thank you!
@root - any thoughts on doing a pi cycle indicator within the dashboard?