

Cycle Analysis
Bitcoin's 4-year cycle

After our enlightening discussion on seasonality last week, we're diving deeper into Bitcoin's seasonal price patterns with a fresh analysis. Missed our previous discussion? Catch up here:

Today's Focus: The Four-Year Cycle
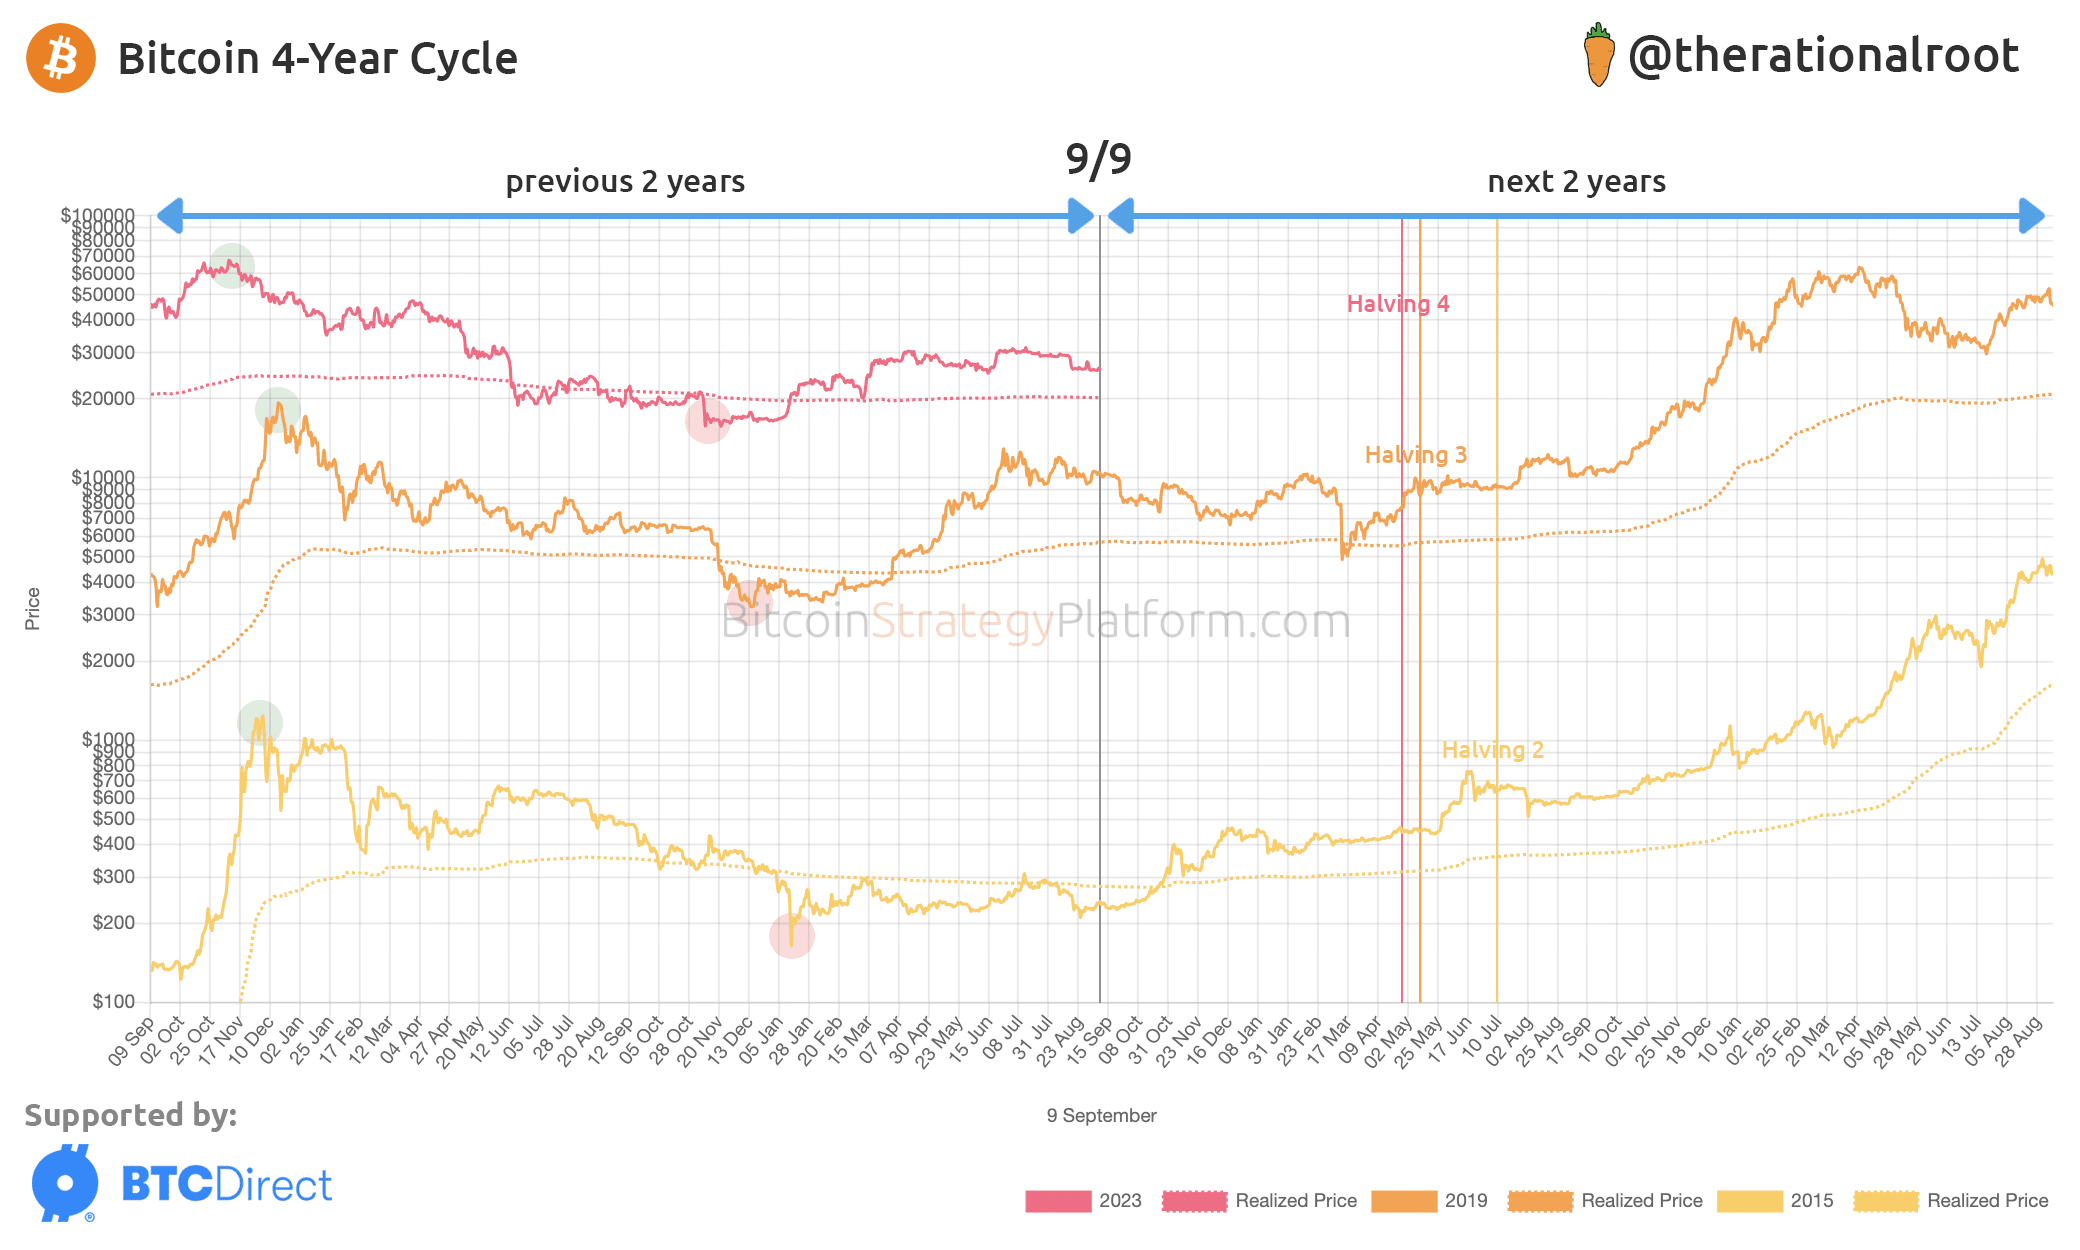
We've charted the 4-year cycle, using today's date as a reference and comparing it with the same day in previous cycles. The vertical gray line represents today, with two years visualized on either side.
NEW CHART:
👆 Live available at the platform under “Cycle analysis“ -> “Seasonality“
(for paid subscribers only).
Key Insights:
Cycle Peaks and Troughs: Notice the striking alignment of these crucial points across cycles.
The Halvings: These significant events can be seen to slightly shift every 4 years, represented by distinct vertical lines colored according to each cycle.
Relative to Realized Price: Our current position is above the Realized Price, which is the average purchase price of all Bitcoin.
Recovery Comparison: The recovery speed between the cycles varies. It wasn’t as intense as 2019 but was faster than in 2015.
Trend Patterns: All cycles at this stage display a period of downward or sideways price movement.
Anticipating the Halving: We are approximately 7 months away from the next Halving event.
Wrapping It Up
Understanding Bitcoin's 4-year cycle offers invaluable insights for both novice and seasoned investors. As we draw parallels from past cycles, it's essential to remember that while history can provide guidance, the future is never guaranteed. Stay informed, make educated decisions, and always prioritize your investment goals. I'll be here, providing data-driven insights every step of the way. Until next time!
-Root
Hi Root. Thank you for another valuable chart and newsletter. I think it is very interesting and I am happy receiving and learning about the on chain analysis. I am trying to understand the charts better.
Based on last cycles (2019) we are like going down in the coming 4-6 months. The 2015 cycle shows a different view (ie back then the bottom was already in and we were slowly going up for the next 20 months).
Is there any way to compare the current behaviour on chain to favor one scenario over the other? I looked at the STH Supply chart and I see that the STH supply is going down. This also happened (more or less) in 2019 (and not in 2015) so to me this would indicate that we are likely going down for some months. Is this a correct on chain analysis or am I seeing things that are not there?
What is the significance of the quicker halving cycles ? more money flowing in ? Will the top be sooner too.