

A pivotal moment in the cycle
Change of the Short-Term Holder Volatility Trend

Bitcoin’s compressed price led to a break-down. In a flash crash, Bitcoin dropped from nearly 29,000 to 24,750 in just several minutes. There’re rumors circulating that Elon Musk sold $373 million worth of Bitcoin, but there is no confirmation if this is true. Additionally, some other news claims it was due to Evergrande, the second-largest property developer in China, that reportedly filed for bankruptcy.
Let’s avoid the rumors and look at what the charts and on-chain data tell us, because the thruth is that a large sell order, no matter where it comes from, can push price down in a relative illiquid market.
With hype effectively gone during this phase of the cycle, observed by low values of Short-Term Holder Supply, Bitcoin tends to be more illiquid. This can also be observed through the low on-chain transfer volume.
Since we only got a flashcrash, it’s yet to be confirmed if we truly get a sustained trend below several Key Levels (including the Short-Term Holder cost basis) mentioned in last week’s newsletter. We talked about how to expect mainly choppy and sideways price action. Let’s discuss this in further detail.
A pivotal moment in the cycle, change of the Short-Term Holder Volatility Trend
👉 We are at a pivotal moment in the cycle, namely, a change of the Short-Term Holder volatility trend. Let me explain.
Short-Term Holders (STHs) are most susceptible to emotions and price action and therefore reveal valuable insights about potential price levels. In below chart we look at price (pink) and the average purchase price of STHs (dotted green).
In the bottom part of that chart we look at how far price falls below the average purchase price of STHs, measured in standard deviations. For each cycle we see a clear trendline (orange) that reveals the reducing volatility after the exponential price increase seen during a hype phase. The hype phase, catalyzed by the halving, causes an impulse that dampens along the way.
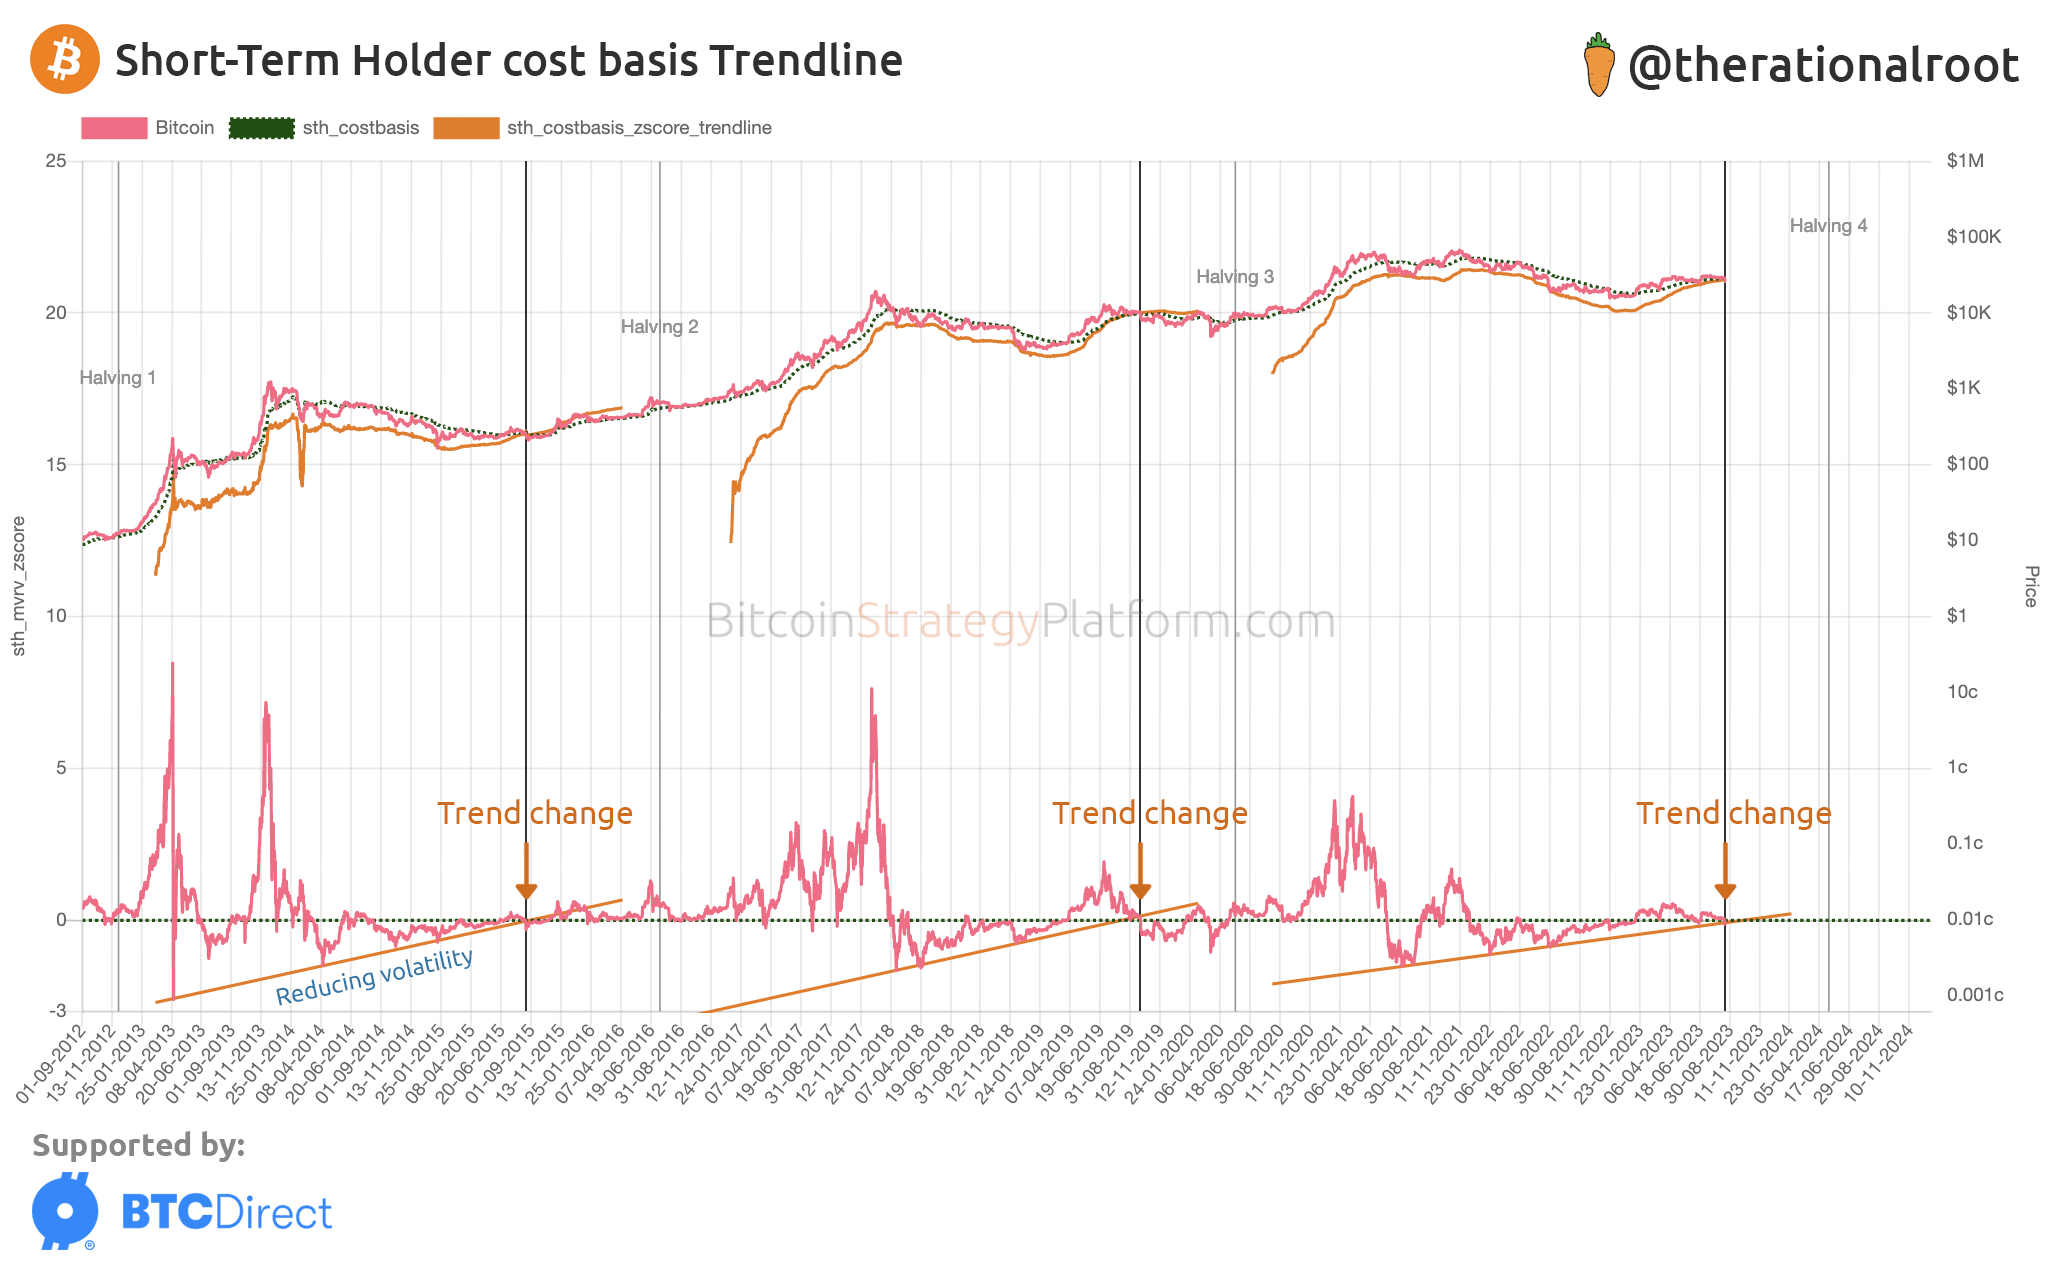
👆 View live chart at the Bitcoin Strategy Platform.
The pivotal moment happens when the trendline, which shows how Bitcoin’s price compresses, crosses above the average purchase price. Bitcoin’s price breaks free of the compressed zone, and floats freely in a phase of indecision, historically causing choppy sideways price action.
Get access to the Bitcoin Strategy Platform with LIVE charts & Full content. 30% discount ending soon!
In each cycle during this phase, Bitcoin spends some time below the average purchase price of STHs. For comparison, below chart highlights the year leading towards each halving. The green zones is when price is above the STHs cost basis and red when below. Note how this cycle has been mostly green.
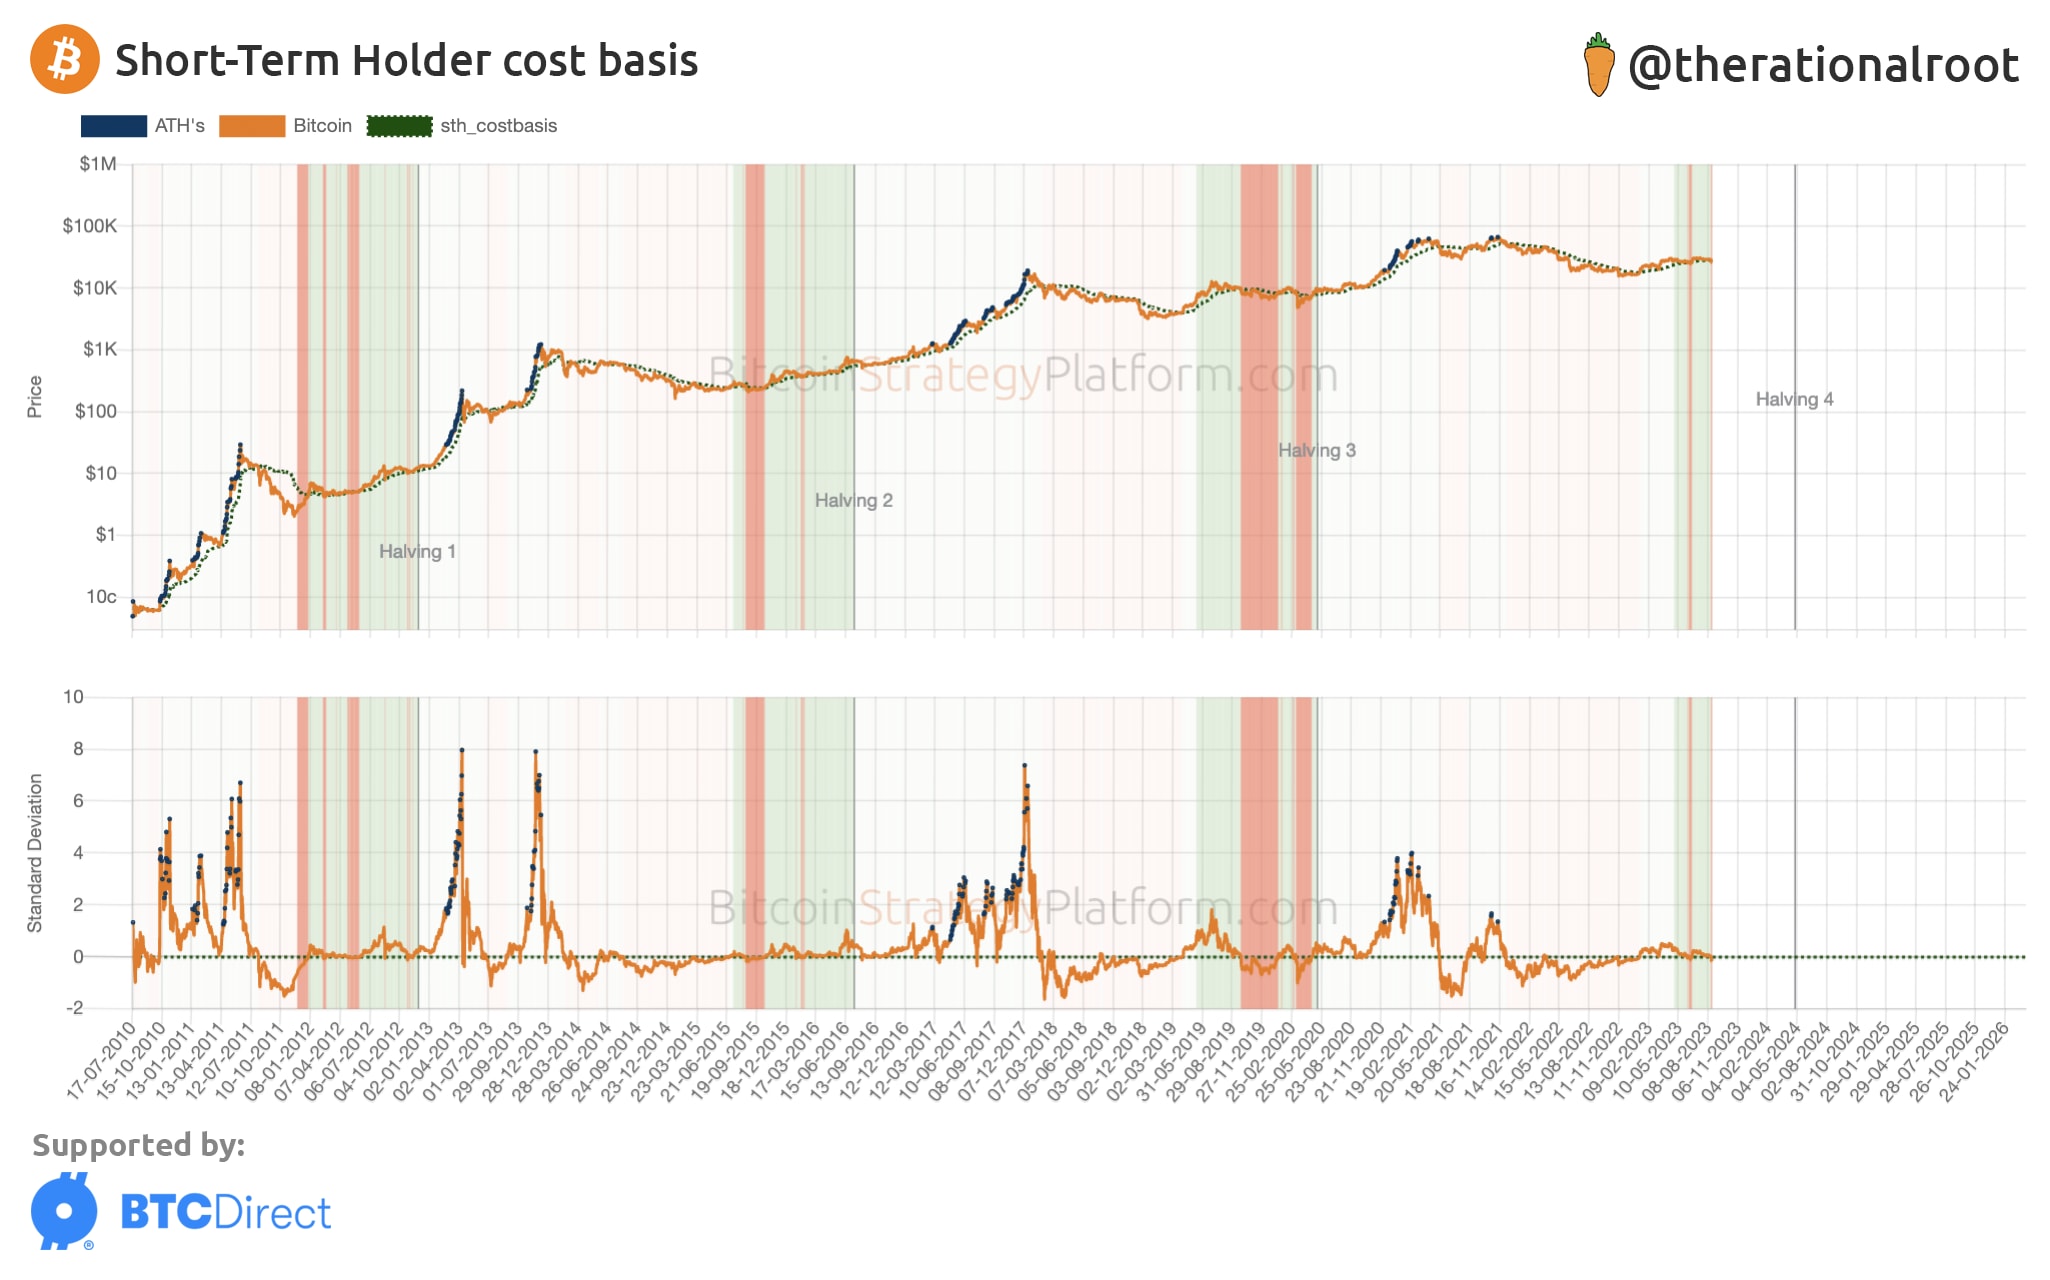
👆 View live chart at the Bitcoin Strategy Platform.
Especially in the previous cycle there were large red zones, which was a result of the steep increase in price at the beginning of 2019 and due to the covid black swan event.
How low can price go this time?
